How Police could effectively pre-empt riots
10 Aug 2011Over the past few days we have seen violence escalate dramatically in different cities across England, with London being the primary location. Acts of violence, rioting, looting, and arson have taken place at night for several days.
I have been attached to the BBC News coverage through their website and I saw an interesting tweet posted there:
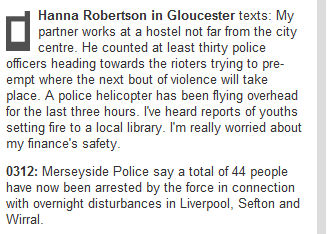 At first I thought. Pre-empt where the next bout would take place? How on earth would they manage that?
But it actually isn’t that hard. They have a mountain of CCTV data, they have a good amount of servers, all they lack is a bit of artificial intelligence.
The best way I can think of to determine where possible bouts of violence could sprout in what seems like an apparent random non-deterministic method of choice is as follows:
The IT team of the police should annotate the direction of each CCTV camera, including which streets are in view and the coordinates.
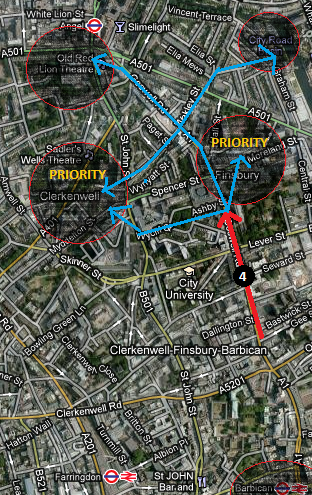
Afterwards, the CCTV cameras should be plotted on a 2D map, as vectors (pointing in the direction they are facing, with the length of the vector being the distance the camera covers).
 Additionally, all points of interest should be mapped, such as shopping centres, residential areas, commercial areas, shops with high-value items, and shops with low-value items. Most of this data can be readily obtained from Google Maps, amongst other online maps. This data can be extracted and annotated with the values we require (such as the value of the goods sold per area, etc.)
If you think this is a very hard task, it is not. A very simple way of doing this would be to go to the website (or ask by phone) of each major retailer and chain for a list of addresses of their shops. Google Maps can plot them on a map using a spreadsheet as input. There you go, simple as that!
A Machine Learning program could be developed using WEKA (for instance), in which an SVN is programmed to take data from the map-plot, where priority spots include places where high-value items are sold. Additionally, it would take data from each CCTV camera.
Now, how do we represent the data from CCTV cameras? One way would be to take a selection of pixels from each camera, measure the amount of change for a second, and wherever there is a large enough change in different areas of the same camera, we might have a lot of movement going on. So we automatically annotate the data per CCTV camera as having “movement” or “no movement”. Additionally, a range from 0-1 would produce better results (hopefully).
So now we run an SVN machine on the data and hopefully come up with some interesting results.
What could essentially be obtained from this is a vector describing the movement of as mass of people from camera to camera, this vector would be projected on the 2d map. Multiple vectors could be plotted at the same time if there were multiple riots taking place at the same time in the city. A confidence level can be given to each vector (assuming we have built in a few mechanisms to differentiate people from cars, etc). The places of interest could be mapped as hotspots, and furthermore we can predict paths to possible places of interest, derived from the speed and direction of each vector.
So there you go. If you belong to the MET, please share this blog post with your boss (or the IT team) and get working on a system to perform such actions, it would certainly help prevent further stupidity in the future. 6,000 police officers should be able to deal with outbreaks of crime provided they knew where the rioters would be gathering and where they are heading.